

Jerry Mitrovica is a solid-earth geophysicist, but the description is inapt. He spends much of his time demonstrating that the earth is not firm at all—it moves. His lab in Cambridge, for example, oscillates up and down by nearly eight inches twice a day. Mitrovica is a pioneer of dynamic topography, the study of such vertical motions. For most people, these ebbs and flows are new ground. But for Mitrovica, who investigates changes large and small to the planet’s shape, on timescales ranging from hours to eons, using evidence that ranges from the history embedded in coral to eclipse records, it’s terra firma.
His research, of fundamental importance to earth scientists, also has a public resonance, because his discoveries about the planet’s plasticity, and his explorations of its shape-changing past, bear directly on the problem of melting ice sheets and rising sea levels in an era of rapid climate change.
Fame of the academic variety came early to Mitrovica and mushroomed about a decade ago, when he reminded people what happens to local sea levels in the vicinity of a melting ice sheet, like those covering Greenland and Antarctica. The effect was first described a hundred years ago, but “people had forgotten how big it was,” he says. “It’s big.” If Greenland’s ice sheet melted entirely, sea level would fall 20 to 50 meters at the adjacent coast. That’s counterintuitive, but the ice sheets are so massive (Greenland’s ice, one-tenth the size of the Antarctic ice sheets, weighs on the order of 3,000 trillion tons) that two immediate effects come into play. First, all that ice exerts gravitational pull on the surrounding ocean. When an ice sheet melts, that gravitational influence diminishes, and water moves away from the ice sheet, causing sea levels to drop as far as 2,000 kilometers away. (The drop is most pronounced close to the glacier, because gravity’s effects dissipate with distance.) But because the sea level has fallen where the ice sheet melted, it rises everywhere else beyond that 2,000-kilometer boundary, and on distant shores this rise is far greater than the global average. The effect amplifies the rise in average global sea level attributable to the addition of the meltwater itself to the oceans. (Greenland alone contributed a trillion tons of melted ice from 2011 to 2014.) Second, the land beneath the now-vanished ice sheet slowly rebounds, rising as the weight of the mass above diminishes, a process that continues for thousands of years after the ice sheet is gone. Locally, this doubles the relative drop in sea level. But globally, the uplifting crust pushes water outward, further raising sea levels around the world.

Satellites have measured absolute annual changes in sea level from 1993 to 2010 (mm/yr), independent of shifts in the height of land.
Courtesy of Carling Hay
Click image to see larger version
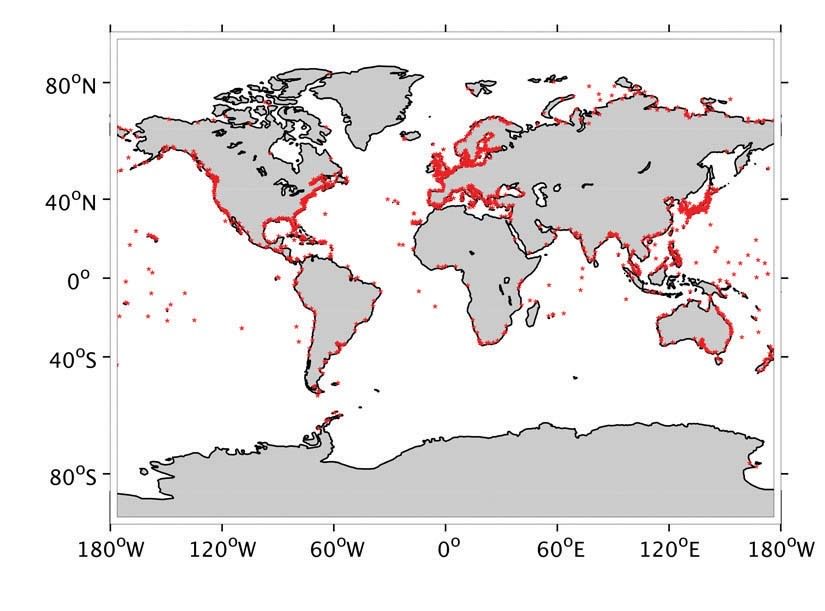
A global network of tide gauges records changes in sea level relative to land, which also moves up and down.
Courtesy of Carling Hay
Intuition guides people to think of the ocean as a bathtub, says Mitrovica: add meltwater and sea level rises equally everywhere. He remembers the reaction at a lecture in the Netherlands when he explained that the sea rises most at the places farthest from the melting source. “You have less to worry about from the melting of Greenland,” 3,000 kilometers away, “than from ice sheets in Antarctica,” he explained to his Dutch audience. But even well-educated people trained to challenge intuitive judgments don’t believe it, he says. That counterintuitive finding matters today because temperatures are rising faster toward the polar regions, where ice sheets still remain, but the effect on sea level will be felt most strongly far away, along the coasts where much of humanity has settled.
Data from global tide gauges stretching back a century have confirmed differences in the rate of sea-level rise from one place to another. Mitrovica’s work not only explained why this is so, but showed how the signals from each melt source—the pattern of progressively higher rates of sea-level rise at locations farthest from an ice sheet—could be disentangled to infer how rapidly Greenland’s ice sheets, or those in Antarctica, are melting. Among the places distant from both poles that will be hit hard are the east and west coasts of North America.
Probing the Paleoclimate
Despite the public interest in Mitrovica’s work, his main focus is neither the present nor the future. He uses geophysics principally to study paleoclimate during, for example, the mid-Pliocene ice age of three million years ago, when “the earth was as warm as we are about to get in the next 100 years—and yet we don’t really know how the polar ice sheets fared.” Figuring out what happened to them, and by extension, to sea level, he explains, poses “questions that a solid-earth scientist can answer.” At the beginning of his career, Mitrovica never imagined that his research would become politicized.
Focusing on the distant past, he says, also affords him and his students a temporary refuge from politically charged scientific debates: “Sometimes we avoid modern climate questions just because there are thousands of people who study them, and it is nice to be able to take a little bit of time to just think through things. We have had the luxury of doing that more than we would have if we were 100 percent in modern climate research.” The reaction to a 2015 paper on modern sea-level rise by his postdoctoral fellow Carling Hay underlines the point. “Carling demonstrated that the rise in global average sea level during the twentieth century proceeded at a slower rate than previously believed,” Mitrovica says. Climate-change skeptics pounced, claiming, “‘You see, it is not as bad as we thought.’”
“But this was in no way a good-news result,” he continues. After taking into account contributions such as melting glaciers and ice sheets, and thermal expansion of the warming oceans, they concluded that global average sea level rose between 1 millimeter (mm) and 1.4 mm annually between 1901 and 1990, significantly less than previous estimates (1.6 mm to 1.9 mm per year). But they estimated that between 1993 and 2010, the average global sea level rose at about 3 mm per year, in agreement with other published estimates. Accordingly, they concluded, sea-level rise from the twentieth to the earliest part of the twenty-first centry is accelerating faster than previously believed, and faster than at any time in the past 5,000 years.
“You write a paper like this, and you think the message is clear, but people can misrepresent the message quite easily. It’s a lesson,” he says. Having been “caught up in that mud that comes from studying modern sea level,” he adds, resignedly, “These are important problems. We will always do them when we feel we have a contribution to make, but the pushback on these issues does make you a little bit weary.”
At the beginning of his career, Mitrovica never imagined that his research would become politicized. He completed his undergraduate and graduate studies at the University of Toronto, a center of plate-tectonics research. His first major paper was on the topography of the American West, where the interior of the continent was under water some 80 million years ago. Debate was raging over whether the land had sunk or the sea had risen. With guidance from a generous colleague, Christopher Beaumont at Dalhousie University, Mitrovica showed that the western half of the North American tectonic plate had tilted downward, causing the ocean to inundate the interior. At the time, he declares, “I can assure you, I wasn’t thinking of it as a sea-level problem. I was thinking of it as a plate-tectonics problem. It never dawned on me that I was entering into what is now called ‘long-term sea-level research.’”
How Earth Shapes Its Climate
Mitrovica came to Harvard from Toronto in 2009 for opportunities to expand his interdisciplinary research. “In Toronto, for example, we did no work on ice-sheet stability, and we didn’t look at the statistical analysis of climate signals.” Since arriving in Cambridge, he and his students have “branched out in ways I would not have predicted, and each of them has really made an important contribution.” At Harvard, he landed among people like professor of earth and planetary sciences Peter Huybers, with whom he and his students have collaborated on a number of important papers, and Adam Dziewonski, then Baird professor of science, who pioneered the use of seismic tomography—the measurement of waves propagating from earthquakes—to create images analogous to sonograms of the earth’s interior.
“Earth is not an onion with layers that vary with depth,” Mitrovica explains. “There are large-scale changes sideways.” Imagine for the first time having a tool that “tells you how things vary laterally.” Dziewonski’s revolutionary work revealed the existence of two “large and deep vertical structures” with defined edges, one beneath the continent of Africa and the other under the Pacific Ocean, and thus changed the way geophysicists modeled everything from plate tectonics to deformations in the planet’s shape. “Earth is not an onion with layers that vary with depth,” Mitrovica explains. “There are large-scale changes sideways.”
His presence in the office next door also influenced the work of one of Mitrovica’s current graduate students, Harriet Lau. Inspired by seismic tomography, Lau is attempting to develop a parallel technique, “tidal tomography,” using the daily rise and fall in land elevations, like the eight-inch flux observed in Cambridge, to see whether these movements can enhance understanding of the planet’s internal structure. Measured by GPS receivers on the earth’s surface, such “body tides,” which vary by geographic location, are caused by the same predictable forces that drive ocean tides (the gravitational pull of the sun and the moon). The goal of Lau’s ambitious work is to determine whether the two large structures Dziewonski imaged are buoyant, energetically upwelling features, or dense anchors on the slow creep of rock within the earth’s rocky mantle. Answering that question will shed light on the pace of the earth’s evolution since its birth 4.5 billion years ago, a key unresolved issue in understanding how the atmosphere, ocean, geology, and climate have changed over time.
“When most people think of climate, they think of the atmosphere and things like that,” Mitrovica says. “They don’t imagine that the solid earth plays any role in the evolution of the climate system.” In fact, “it plays a crucial role.” For example, at the height of the last ice age, glaciers covered Canada, Scandinavia, and much of the northeastern United States. Twenty thousand years ago, the glaciers began melting; by 5,000 years ago, they were nearly gone. But how much ice was there at the glacial maximum? Scientists want to know because that will tell them something about ice-age climate and about how the ice sheets responded to cooling and warming.

Coral reefs in Barbados, above, reveal changes in sea level relative to land. But did the sea fall, or did the land rise?
Photograph by Bill Thompson/WHOI
One way to estimate the size of those ice sheets, which locked up a lot of water, is by reconstructing what happened to sea level as they melted. Scientists often use Barbados as a gauge to calculate ancient sea level because the island lies far from the polar ice sheets’ maximum extent. Cliffs of fossilized coral, which grows only underwater, ring the island and record how sea level has changed in the past 20,000 years. But “the problem with that is that Barbados is not a magical meter stick,” Mitrovica explains. “It is influenced by a number of solid-earth processes.” Some of these geophysical processes cause the island to sink, others to rise. “There is no way to model those processes accurately if you don’t know something about the structure underneath Barbados. To get a measure of how much water entered the ocean as the glaciers melted, you have to know how the crust around Barbados” uplifted as a result of forces ranging from plate tectonics to deformations caused by the melting ice itself. Information gleaned from seismic or tidal tomography, he hopes, “will allow us to better constrain that internal structure and improve our estimates of ice volumes.”
Several years ago, Mitrovica’s graduate student Jacqueline Austermann used seismic imaging of the structure beneath Barbados, which included a portion of a tectonic plate that had descended beneath the crust, to do just that. She found that the existing consensus of a 120-meter rise in sea level was low by as much as 10 meters, or about 33 feet. In other words, an additional volume of water greater than that now stored in the Greenland ice sheet had been missed. (The Greenland ice sheet currently holds enough fresh water to raise average global sea level 20 feet, while the Antarctic ice sheets hold another 200 feet). The melting of that much ice would be sufficient to affect sea level significantly, to deform the earth’s crust, and even to affect the axis of the planet’s rotation.
“The better we understand the earth’s internal structure, the more we can learn about paleoclimate,” says Mitrovica. Lau’s work, in other words, has an application well beyond describing the structure of the deep earth. “Imagine, she is using tides measured by GPS receivers around the world to improve estimates of ice mass 20,000 years ago,” he says. “It is shocking in a way, but more and more scientists are making these connections, and I think that is a really positive development.”
Last year, Mitrovica won the Geological Society of America’s Day Medal, which recognizes “outstanding distinction in the application of physics and chemistry to the solution of geologic problems.” The award was given in part for research that tackled a problem that had been unresolved for nearly 15 years: Munk’s enigma. Walter Munk, a renowned professor emeritus at the Scripps Institution of Oceanography, argued that if all the land-based ice that has supposedly been melting for the last century really has been melting, the water that was released from polar regions should have flowed toward lower latitudes and the equator—and this redistribution of mass should have slowed the rotation of the earth (much as spinning skaters slow as they extend their arms). But modern satellite observations suggested that the earth’s spin has not slowed as much as forecast. Although Munk wasn’t questioning estimates of sea-level rise per se, his enigma posed a serious challenge to earth scientists involved in studies of global warming.
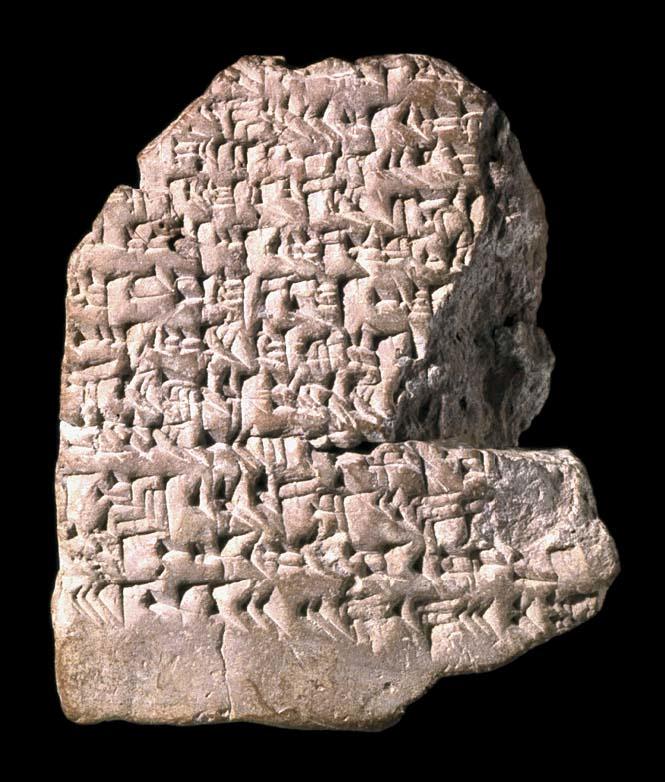
Eclipse records, like this Babylonian report written on a clay cuneiform tablet from January 30, 10 b.c.e., reveal that Earth’s rotation has slowed through time.
Courtesy of The British Museum
The solution to the enigma required a reanalysis of a very different class of Earth rotation data. Specifically, ancient eclipse records extending back thousands of years from “Babylonian, Chinese, Arab, and Greek astronomers indicate that the earth’s rotation has slowed about four hours” in two and a half millennia, Mitrovica explains. Geophysicists have long attributed this slowing to two effects. First, tides crashing on shorelines apply a brake on Earth’s rotation—an effect known as tidal dissipation. The second is a remnant effect of the last ice age. “The earth 20,000 years ago was covered by ice at the poles” and that mass “squished the solid earth down, so that the earth’s shape was a little flattened. As those ice sheets melted—and continuing to the present day—the earth has gradually become more and more spherical,” and therefore less flattened—and fattened—at the equator. “As it comes back,” he says, linking the planet’s evolving geometry to figure skaters drawing their arms in—“it’s speeding up.” These two effects neatly added up to the four hours of slowdown evident in the eclipse record.
But Mitrovica and his colleagues realized that a very important process had been left out of this analysis. Magnetic coupling between the earth’s iron core and its rocky mantle has also been causing the rotation of the crust to slow. When Mitrovica’s team included this braking effect, the numbers no longer worked. They realized that the ice-age model scientists had been using in their calculations had been inaccurate. The model had to be revised so that all three effects—tidal dissipation, ice-age shape changes, and magnetic coupling—added up to the four hours of slowing.
How does that connect to Munk’s enigma, which asked why modern glacial meltwater had not measurably slowed the earth? The answer is a roundabout one. Modern satellite measurements allowed scientists to make an independent measurement of the earth’s rotation. When the satellite data were corrected for ice-age effects using the new model that fit the eclipse records, a small, unexplained slowdown was revealed. This discrepancy, Mitrovica says, was precisely the signal one would expect from the melting of glaciers during the past century. Munk’s enigma was solved—and another, albeit subtle, perturbation to the progressively warming Earth system was revealed. As Mitrovica explains, “Munk’s enigma reinforces my view that significant progress in understanding the real, long-term effects of climate change—past, present, and future—will sometimes require that we look downwards to embrace the complex, dynamic evolution of the solid earth.”


